
INFOGRAPHICS
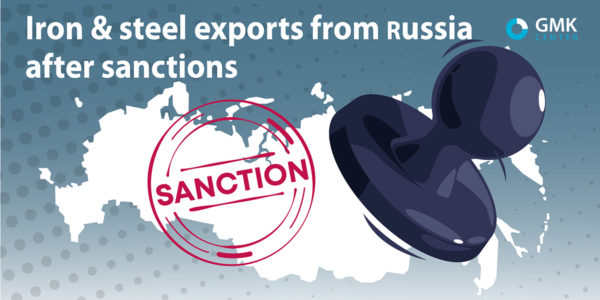
27 September 2022
The most demanded Russian products are pig iron and steel semi-finished products
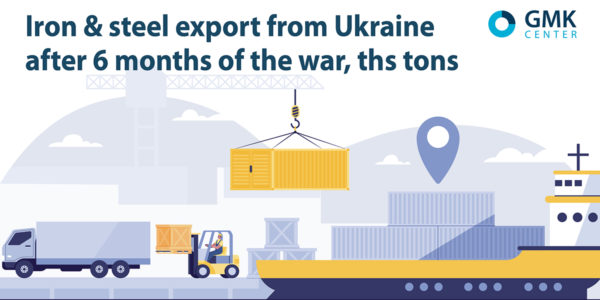
15 September 2022
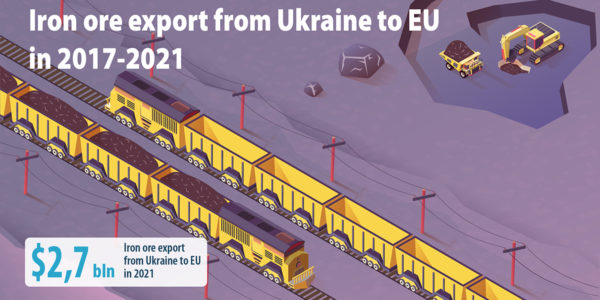
Due to the blockade of Ukrainian sea ports, the EU remains the main export destination
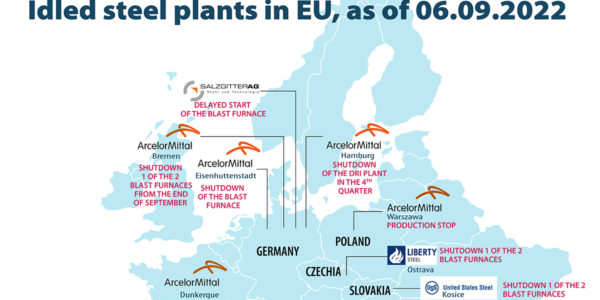
06 September 2022
Fifteen European plants suspended or plan to suspend steel production
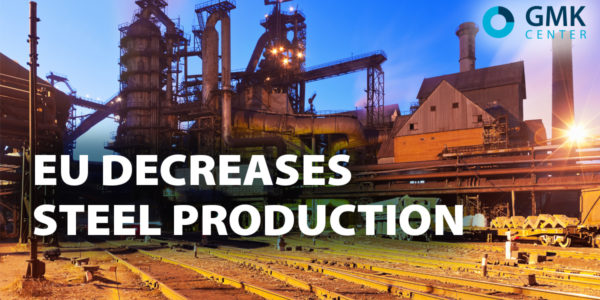
01 August 2022
Nine European plants fully or partially suspended steel production
05 July 2022
Due to the war and unfavorable market conditions, supplies began to decline
Infographic mining & metals sector of Ukraine
26 May 2022
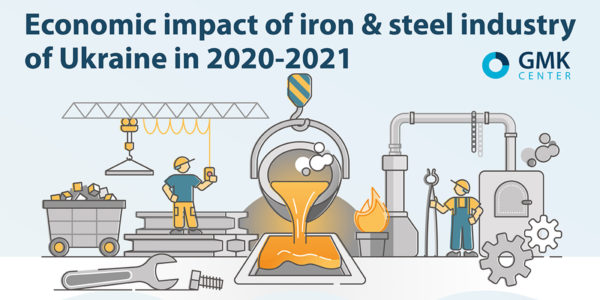
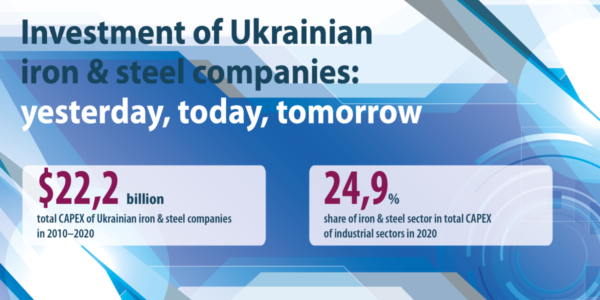
Ukrainian iron & steel companies also invested $2.0 bln in 2021
05 May 2022
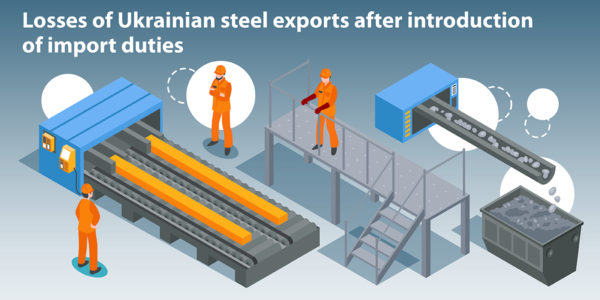
Ukraine lost more than 1 mln tons of annual steel export because of trade restrictions in EU and USA
03 May 2022
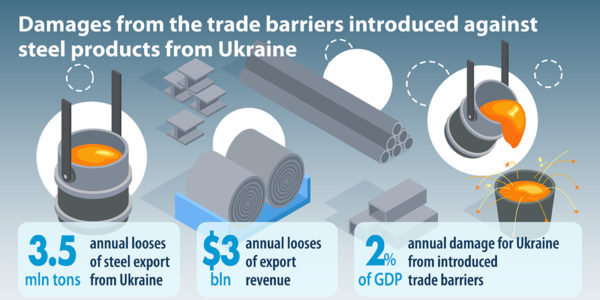
Trade barriers against steel products cost 2% of Ukrainian GDP
Infographic capital investment
17 December 2021
Average annual capital investment in the mining & metals sector has reached $2 billion in 2010–2020