
INFOGRAPHICS

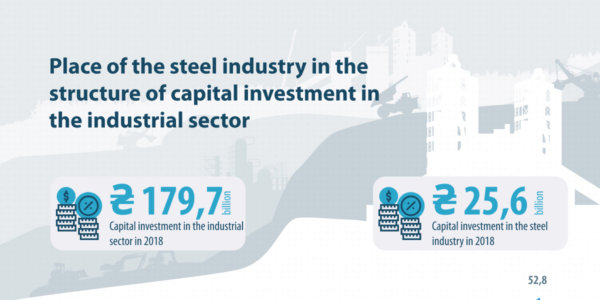
Infographic capital investment
09 November 2020
Equity capital of companies and organizations remains the main source of capital investment funding
01 October 2020
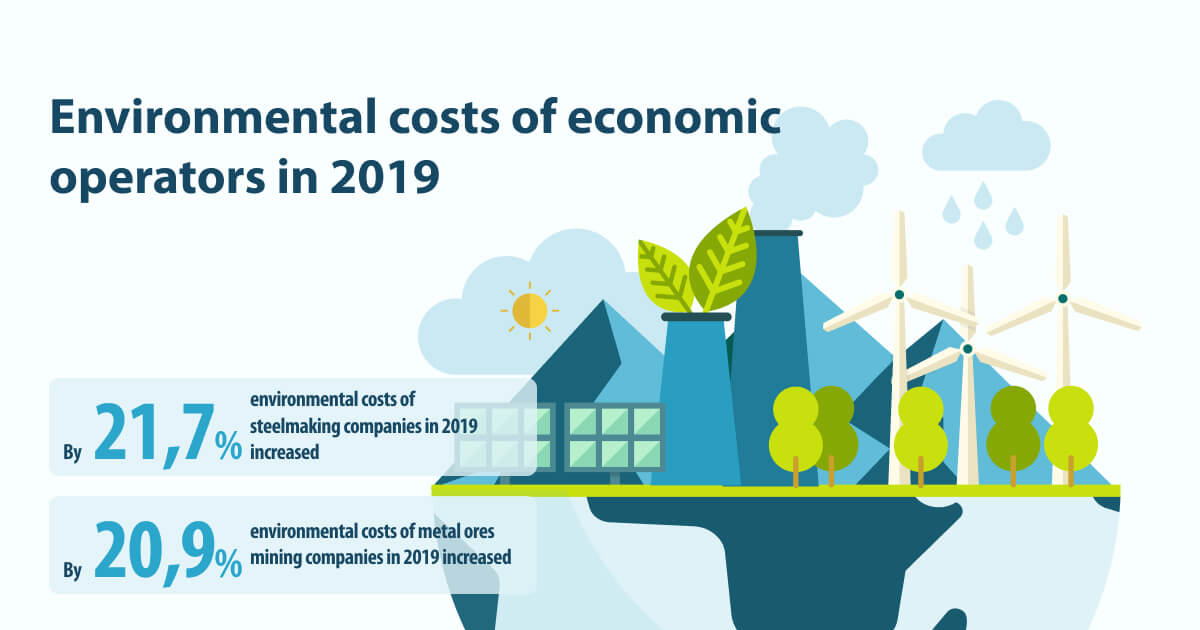
Environmental costs in the mining & metals sector grew by 22% in 2019
31 March 2020
One steel worker in Ukraine creates 2.2 jobs in related industries
02 September 2019
The margin of electric arc steelmaking companies is at the minimum.
30 August 2019
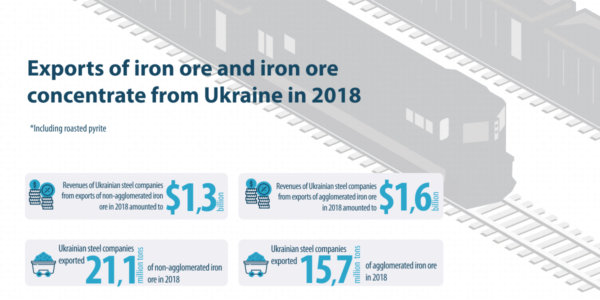
China remains the key importer of Ukrainian raw materials
28 August 2019
Which other industrial sectors receive investment
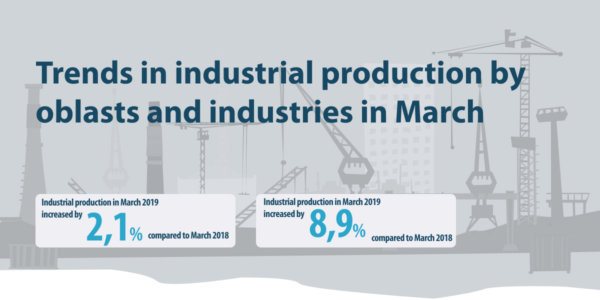
Infographic industrial production
26 August 2019
In March, the industrial production index of the steel industry was 108.9% compared to March 2018.
23 August 2019
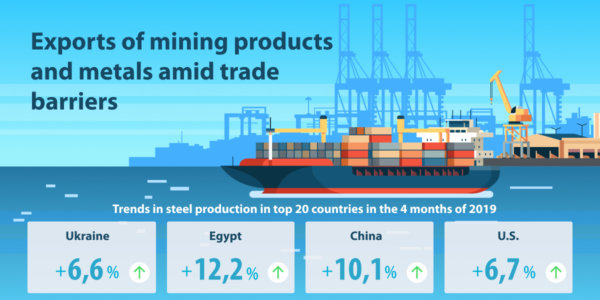
Ukrainian producers have increased exports of steel products by 7.5% over the four months of 2019.
Infographic capital investment
22 August 2019
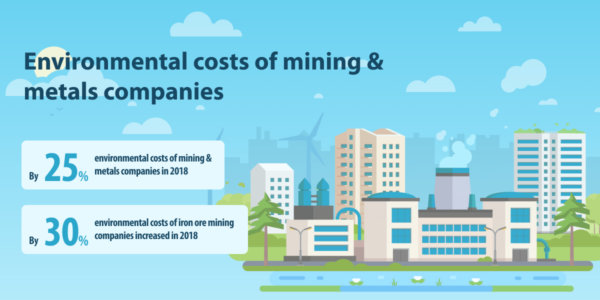
Environmental costs of mining & metals companies amount to around 40% of their total costs