
import - Latest news GMK Center
30 October 2025
During the period, there has been a significant increase in shipments from Turkey, China, and South Korea

28 October 2025
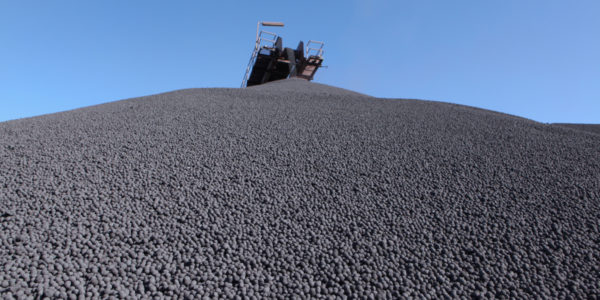
October iron ore supplies may become the second largest in the country's history
28 October 2025
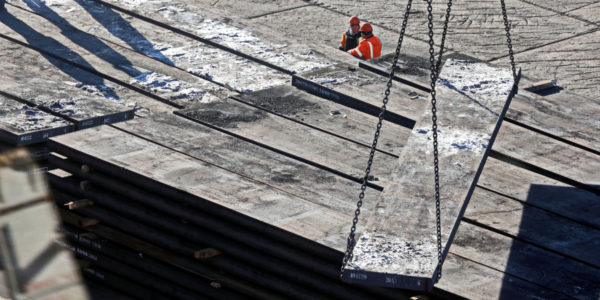
Pig iron, semi-finished steel products and direct reduced iron account for the bulk of the volume
27 October 2025
The indicator was affected by a significant decline in imports by Germany and the Netherlands
Polish products account for the bulk of supplies
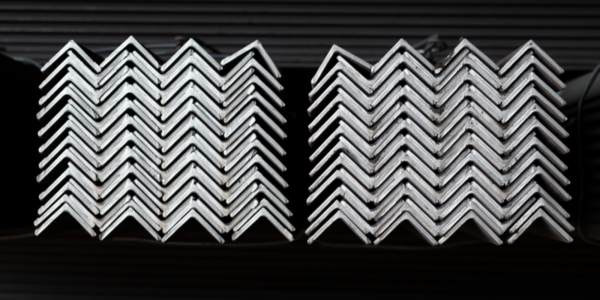
The main imports are angles, shaped and special profiles

20 October 2025
The real scale of Polish exports to Ukraine is twice as high as Ukrainian statistics show
17 October 2025
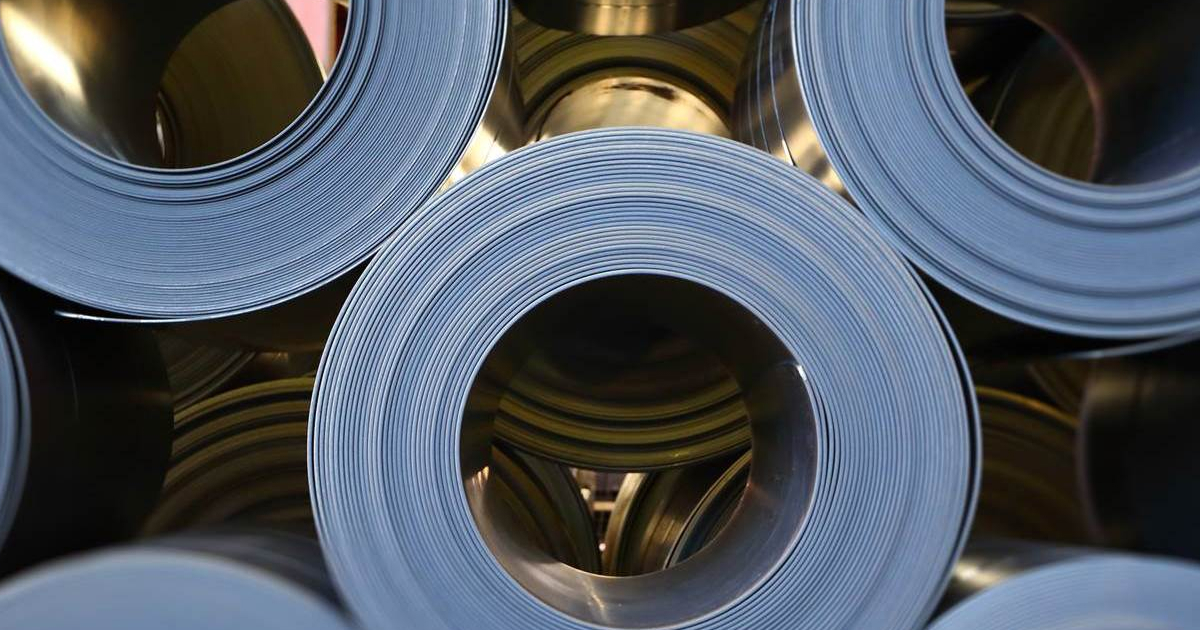
About 50% of imports are coated flat products
02 October 2025
Ukrainian ore accounts for over 90% of Polish imports, but the transition to EAF may reduce demand

30 September 2025
Ministry of Steel requests a levy of $125/t
23 September 2025
The bulk of imports consisted of cast iron, semi-finished steel products, and direct reduced iron
22 September 2025
This figure was influenced by a significant decline in imports by Germany and the Netherlands