
icon

export - Latest news GMK Center
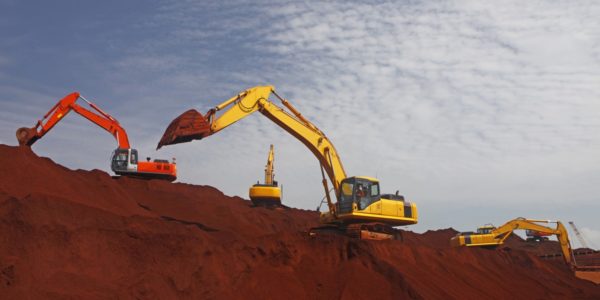
Photo – Ukraine reduced iron ore exports by 4.4% y/y in January-September
Ukraine reduced iron ore exports by 4.4% y/y in January-September

Key volumes of raw materials were sent to China, Slovakia and Poland
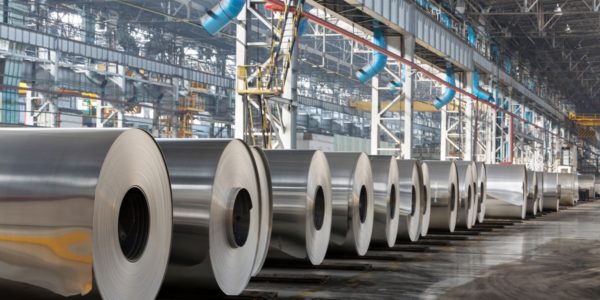
Photo – EU quota cuts pose a greater threat to British steel industry than US tariffs
EU quota cuts pose a greater threat to British steel industry than US tariffs

New EU restrictions could cut Britain off from its largest steel market and exacerbate the crisis in the industry
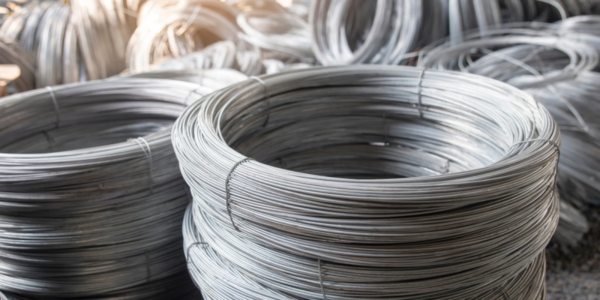
Photo – Flat steel exports from Ukraine exceeded 1.1 million tons in January-August
Flat steel exports from Ukraine exceeded 1.1 million tons in January-August

Hot-rolled flat steel accounted for over 80% of shipments
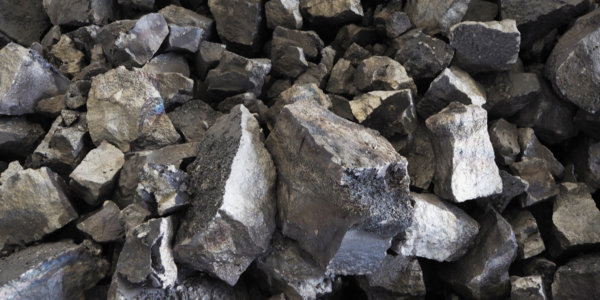
Photo – Ukraine’s ferroalloy industry exported 73.8 thousand tons of products in January-August
Ukraine’s ferroalloy industry exported 73.8 thousand tons of products in January-August

The main volumes of supplies went to Algeria, Poland, and Turkey
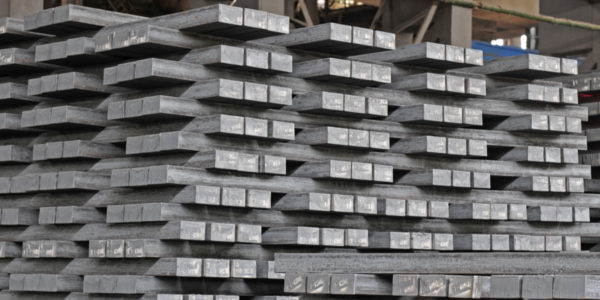
Photo – Ukrainian steel companies reduced exports of semi-finished products by 39% y/y in January-August
Ukrainian steel companies reduced exports of semi-finished products by 39% y/y in January-August

During this period, most of the products were exported to Bulgaria, Turkey, and Poland

Photo – Prices for Brazilian pig iron fluctuated between $400 and $405/t in August
Prices for Brazilian pig iron fluctuated between $400 and $405/t in August

The Black Sea pig iron market (Black Sea FOB) is currently virtually inactive
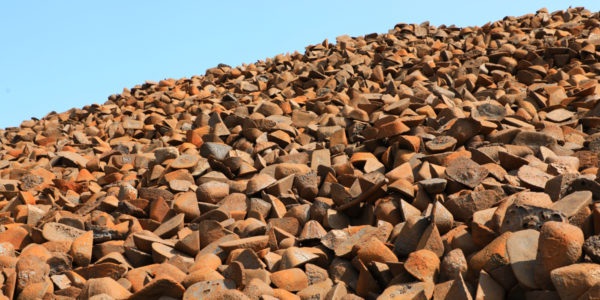
Photo – Ukraine increased its pig iron exports by 65% y/y in January-August
Ukraine increased its pig iron exports by 65% y/y in January-August

The EU and the US accounted for the bulk of Ukrainian product consumption
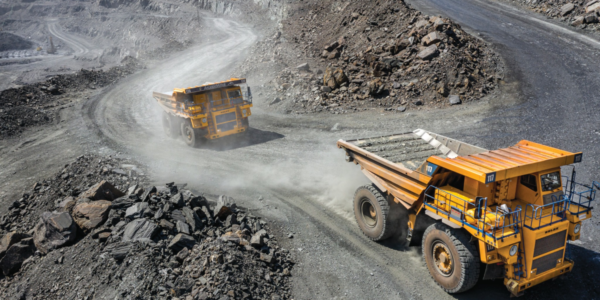
Photo – Ukraine reduced iron ore exports by 7% y/y in January-August
Ukraine reduced iron ore exports by 7% y/y in January-August

Key volumes of raw materials were sent to China, Slovakia, and Poland
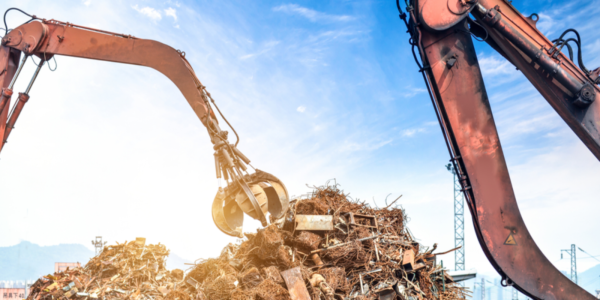
Photo – Germany increased scrap exports by 10.1% y/y in 1H2025
Germany increased scrap exports by 10.1% y/y in 1H2025

Export revenue for the period decreased by 2.6% y/y
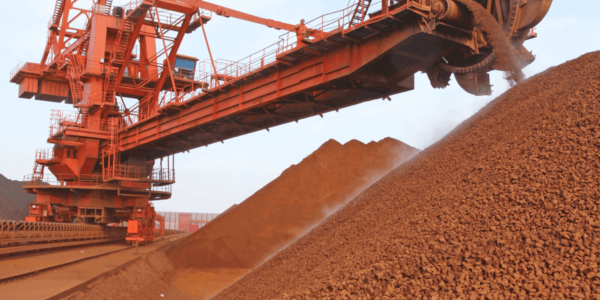
Photo – Australia increased iron ore exports to 75 million tons in July
Australia increased iron ore exports to 75 million tons in July

Demand from China increased, while South Korea and Vietnam reduced purchases
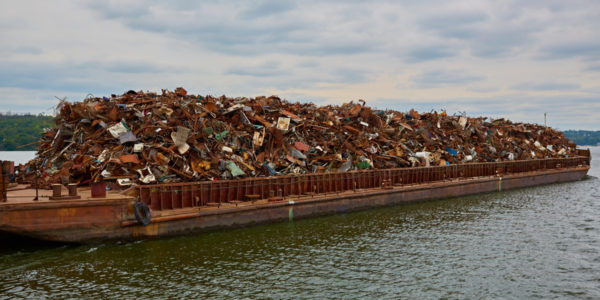
Photo – Scrap exports from Ukraine exceeded 44,000 tons in July
Scrap exports from Ukraine exceeded 44,000 tons in July

Raw material shipments have increased by 66.4% year-on-year since the beginning of the year

1 7 8 9 10 11 56