

News Global Market US 1025 26 March 2026
Total steel imports fell by 37.6% y/y
According to data from the American Iron and Steel Institute (AISI), the United States imported 2.42 million short tons of rolled steel in January–February 2026, a 38.5% decrease compared to the same period in 2025.
Total steel imports, including rolled products and semi-finished products, amounted to 3.31 million tons, down 37.6% year-over-year.
The largest share of rolled steel imports for the period was accounted for by rebar — 227,350 metric tons (-2.8% year-over-year), products for the oil industry — 231,630 metric tons (-38.4% year-over-year), cold-rolled coils – 192,300 tons (-40.5% y/y), and hot-dip galvanized sheets – 187,200 tons (-51.4% y/y).
The largest suppliers of steel to the U.S. in January–February were South Korea – 590,000 tons (+13.6% y/y), Canada – 443,000 tons (-60.8% y/y), Brazil – 424,000 tons (-58.9% y/y), Mexico – 410,000 tons (-45.3% y/y).
In February, 1.17 million tons of rolled steel were shipped to the U.S. from abroad, which is 6.2% less than in the previous month. Total steel imports rose by 0.8% m/m, to 1.66 million tons. Among the most imported products: products for the oil industry – 126,830 tons (+21% m/m), rebar – 114,940 tons (+2.2% m/m), cold-rolled coil – 97,280 tons (+2.4% m/m). Canada shipped 225,000 tons of products to the U.S. over the month (+3% m/m), Brazil – 247,000 tons (+39.4% m/m), South Korea – 305,000 tons (+7.1% m/m), and Mexico – 175,000 tons (-25.4% m/m).
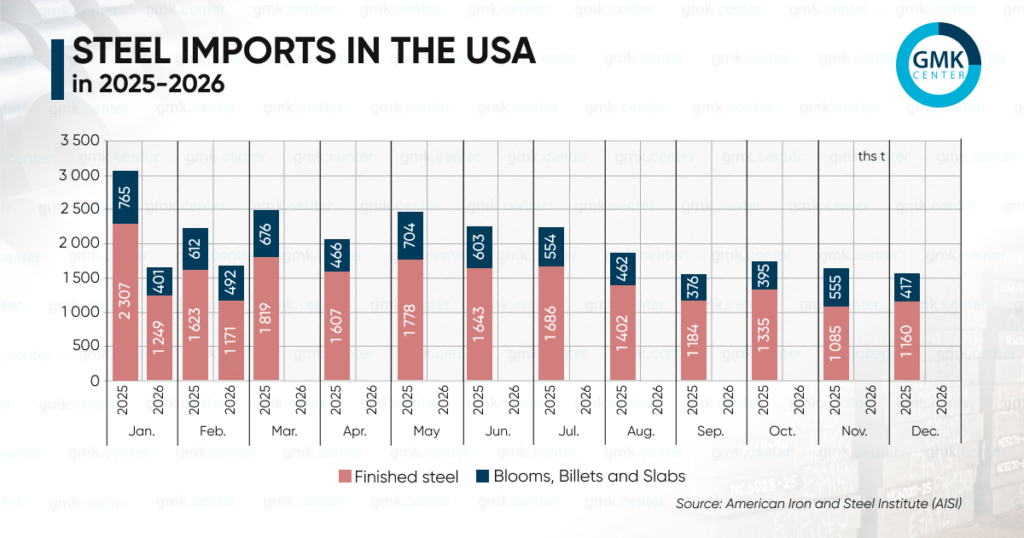
As reported by GMK Center, by the end of 2025, the United States had reduced its imports of rolled steel by 17.1% year-over-year, to 18.66 million short tons. Total steel imports (rolled products and semi-finished products) amounted to 25.24 million tons, down 12.6% year-over-year. Rolled products accounted for 18% of total imports last year.
-

15 June 2026

23 June 2026

23 June 2026

23 June 2026