
Ferrexpo Poltava Mining
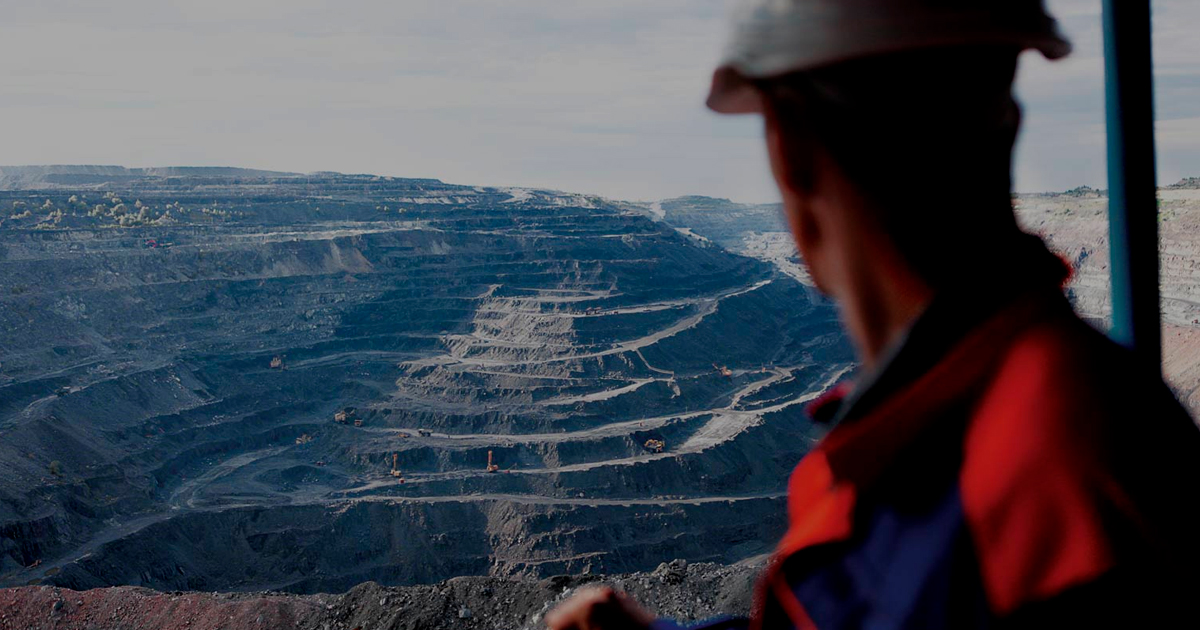
Ferrexpo Poltava Mining (FPM) specializes in production of iron ore pellets. It is a part of Ferrexpo.
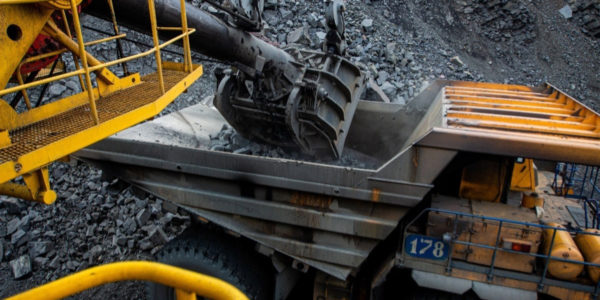
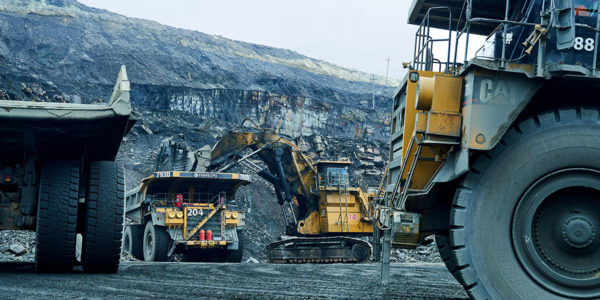
FPM is an integrated company with facilities for mining of crude ore to production of iron ore pellets. The company processes iron ore and manufactures iron ore concentrate and pellets at crushing and benefication plants and iron ore pellets shop.
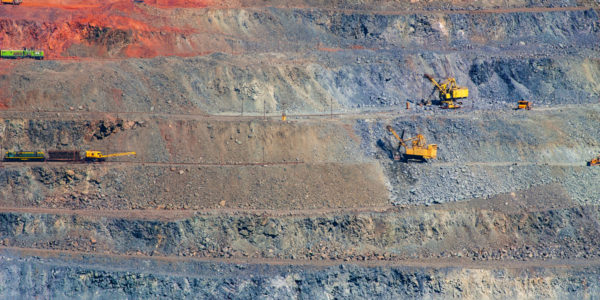
Iron ore is mined by the open-pit method at Gorishne-Plavninske-Lavrykivske deposit (reserves of ferruginous quartzite exceed 1 billion tons). According to the international classification JORC, the company’s proved and estimated reserves reach 703 million tons.
FPM buys part of iron ore concentrate for production of pellets from third-party companies, since its beneficiation capacity is not enough to fully meet its own needs for iron ore concentrate. Also, FPM processes iron ore extracted at Ferrexpo Yeristovo Mining according to a give-and-take model.
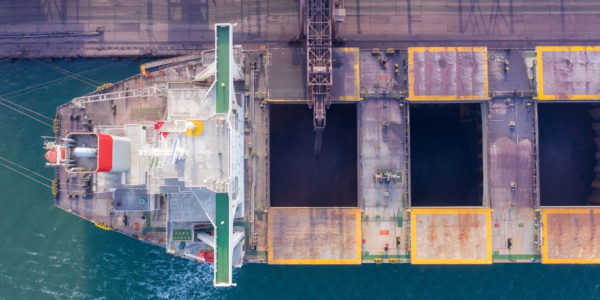
All pellets produced by FPM are exported.
Production capacity
Staff and wages
* per worker before taxes
Charts and tables
Production results, thousand tons
Indicative sales structure by products in 2020*
Indicative sales structure by markets in 2020*
* structure of sales volumes, metric tons
Financial performance, $ million
| 2013 | 2014 | 2015 | 2016 | 2017 | 2018 | 2019 | 2020 | |
|---|---|---|---|---|---|---|---|---|
| Sales | 1053 | 991 | 687 | 662 | 766 | 826 | 993 | 1287 |
| EBITDA | 212 | 290 | -15 | 186 | 319 | 290 | 340 | 667 |
| EBITDA margin | 20.1% | 29.3% | -2.2% | 28.1% | 41.7% | 35.13% | 34.2% | 51.8% |
| Net income | 47 | -146 | -271 | -2 | 160 | 193 | 272 | 411 |
| Net income margin | 4.5% | -14.7% | -39.4% | -0.2% | 20.9% | 23.30% | 27.4% | 31.9% |
| CAPEX | 188 | 148 | 39 | 39 | 74 | 83 | 191 | n/a |
Key facts
2019
Poltava Mining increased its authorized capital by 62.3% or by ₴1.185 billion.
FPM plans to produce 10.6 million tons of pellets from its own iron ore and iron ore mined at Ferrexpo Yeristovo Mining. 9.88 million tons of 65% Fe pellets are planned to be produced in 2019.
2020
Poltava Mining to invest $34 million in a concentrate stockyard.
Sources: websites of the companies, media outlets

29 June 2026
13 March 2026
11 March 2026
09 March 2026
05 March 2026
24 November 2025
21 November 2025
10 November 2025
22 August 2025

21 August 2025