

News Global Market US 1330 16 March 2026
Total steel imports rose by 4.6% m/m but remained 46.3% lower than a year ago
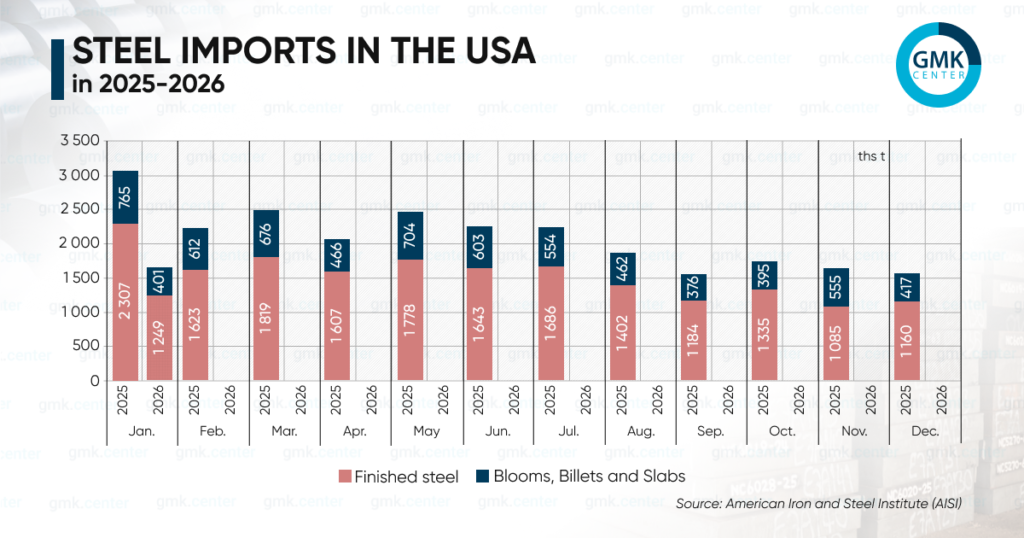
In January 2026, the United States imported 1.25 million short tons of rolled steel, up 7.7% from December 2025 but down 45.9% year-over-year. This is according to data from the American Iron and Steel Institute (AISI).
Total steel imports, including rolled products and semi-finished products, amounted to 1.65 million tons, increasing by 4.6% month-over-month and decreasing by 46.3% year-over-year.
The largest share of rolled steel imports in January was accounted for by rebar—112,420 metric tons (+76.3% month-over-month; -38.6% year-over-year), hot-dip galvanized sheets—107,980 metric tons (+5.4% month-over-month; -49% y/y), heavy sections – 105,770 metric tons (+16.8% m/m; -3.9% y/y), and products for the oil industry – 104,790 metric tons (+24.6% m/m; -60.2% y/y).
The largest suppliers of steel to the U.S. in January were South Korea – 285,000 tons (-31.2% m/m; -69.8% y/y), Mexico – 235,000 tons (+72.1% m/m; -50.2% y/y), Canada – 218,000 tons (-6.6% m/m; -66.3% y/y), Brazil – 177,000 tons (-31.2% m/m; -66.3% y/y), and Taiwan – 73,000 tons (+87.3% m/m; -14.7% y/y).
As reported by GMK Center, by the end of 2025, the United States had reduced its imports of rolled steel by 17.1% year-over-year, to 18.66 million short tons. Total steel imports (rolled products and semi-finished products) amounted to 25.24 million tons, down 12.6% year-over-year. Rolled products accounted for 18% of total imports last year.
-

Opinions Industry steel consumption
13 July 2026

21 July 2026

21 July 2026

21 July 2026